The Neighborhood Map of U.S. Obesity and Food Deserts Available as Data

RTI International released obesity data for the US at the neighborhood level in 250×250 meter grid squares. I downloaded the state files and joined them together into a single PostGIS layer.

wget 'http://synthpopviewer.rti.org/obesity/downloads/AL.zip'
7za e AL.zip

/Applications/Postgres93.app/Contents/MacOS/bin/shp2pgsql -s 3857 '/Users/sparafina/projects/obesity/AL.shp' obesity | /Applications/Postgres93.app/Contents/MacOS/bin/psql -U sparafina -d food_access

/Applications/Postgres93.app/Contents/MacOS/bin/psql -U sparafina -c 'delete from obesity' -d food_access

rm AL.s* AL.cpg AL.dbf AL.prj AL.zip

for s in {'AL','AZ','AR','CA','CO','CT','DE','DC','FL','GA','ID','IL','IN','IA','KS','KY','LA','ME','MD','MA','MI','MN','MS','MO','MT','NE','NV','NH','NJ','NM','NY','NC','ND','OH','OK','OR','PA','RI','SC','SD','TN','TX','UT','VT','VA','WA','WV','WI','WY'}
 do
 f='/Users/sparafina/projects/obesity/'$s'.shp'
 echo $f
 wget 'http://synthpopviewer.rti.org/obesity/downloads/'$s'.zip'
 7za e $s'.zip'
 /Applications/Postgres93.app/Contents/MacOS/bin/shp2pgsql -a -s 3857 $f obesity | /Applications/Postgres93.app/Contents/MacOS/bin/psql -U sparafina -d food_access
done

/Applications/Postgres93.app/Contents/MacOS/bin/psql -U sparafina -c 'create index obesity_gist on obesity using gist (geom)' -d food_access

I converted the grids into points by generating the centroids of the grid.

CREATE TABLE obesity_point AS
 SELECT popgte20, popbmige30, bmivsus, pctbmige30,      
 ST_Centroid(ST_Transform(geom, 4269)) AS geom FROM 
 obesity;

CREATE INDEX obesity_point_gist ON obesity_point USING gist(geom);

The points were then joined to Census tracts and their values were averaged by tract.

CREATE TABLE obesity_tract AS
SELECT AVG(o.popgte20) as avg_popgte20, 
 AVG(o.popbmige30) AS avg_popbmige30, 
 AVG(o.bmivsus) as avg_bmivsus, 
 AVG(o.pctbmige30) as avg_octbmige30, 
 MAX(o.popgte20) as max_popgte20, 
 MAX(o.popbmige30) AS max_popbmige30, 
 MAX(o.bmivsus) as max_bmivsus, 
 MAX(o.pctbmige30) as max_octbmige30, 
 MIN(o.popgte20) as min_popgte20, 
 MIN(o.popbmige30) AS min_popbmige30, 
 MIN(o.bmivsus) as min_bmivsus, 
 MIN(o.pctbmige30) as min_octbmige30,
 COUNT(*) as total_points, 
 t.censustract
FROM obesity_point as o, food_access_tracts as t 
WHERE ST_Intersects(o.geom, t.geom)
GROUP BY t.censustract;

The tracts with the obesity data were then joined to the food desert tracts from the USDA.

CREATE TABLE access_obesity_tract AS
SELECT 
 f.gid,
 f.statefp,
 f.countyfp,
 f.tractce,
 f.affgeoid,
 f.geoid,
 f.name,
 f.lsad,
 f.aland,
 f.awater,
 f.foodaccess_id,
 f.state,
 f.county,
 f.lilatracts_1and10,
 f.lilatracts_halfand10,
 f.lilatracts_1and20,
 f.lilatracts_vehicle,
 f.urban,
 f.rural,
 f.la1and10,
 f.lahalfand10,
 f.la1and20,
 f.latracts_half,
 f.latracts1,
 f.latracts10,
 f.latracts20,
 f.hunvflag,
 f.groupquartersflag,
 f.ohu2010,
 f.numgqtrs,
 f.pctgqtrs,
 f.lowincometracts,
 f.pop2010,
 f.uatyp10,
 f.lapophalf,
 f.lapophalfshare,
 f.lalowihalf,
 f.lalowihalfshare,
 f.lakidshalf,
 f.lakidshalfshare,
 f.laseniorshalf,
 f.laseniorshalfshare,
 f.lahunvhalf,
 f.lahunvhalfshare,
 f.lapop1,
 f.lapop1share,
 f.lalowi1,
 f.lalowi1share,
 f.lakids1,
 f.lakids1share,
 f.laseniors1,
 f.laseniors1share,
 f.lahunv1,
 f.lahunv1share,
 f.lapop10,
 f.lapop10share,
 f.lalowi10,
 f.lalowi10share,
 f.lakids10,
 f.lakids10share,
 f.laseniors10,
 f.laseniors10share,
 f.lahunv10,
 f.lahunv10share,
 f.lapop20,
 f.lapop20share,
 f.lalowi20,
 f.lalowi20share,
 f.lakids20,
 f.lakids20share,
 f.laseniors20,
 f.laseniors20share,
 f.lahunv20,
 f.lahunv20share,
 o.avg_popgte20,
 o.avg_popbmige30,
 o.avg_bmivsus,
 o.avg_octbmige30,
 o.max_popgte20,
 o.max_popbmige30,
 o.max_bmivsus,
 o.max_octbmige30,
 o.min_popgte20,
 o.min_popbmige30,
 o.min_bmivsus,
 o.min_octbmige30,
 o.total_points,
 o.censustract
FROM obesity_tract as o INNER JOIN food_access_tracts as f ON o.censustract = f.censustract;

Each PostGIS layer was export to a sql file via pg_dump. The data is available as a zip file compressed with 7zip. The archive contains the following:

  • obesity_grid.sql – the original RTI data of the US
  • obesity_point.sql – RTI data as points
  • obesity_tract.sql – RTI data averaged into Census tracts
  • access_obesity_tract.sql – obesity and food desert data by Census tract

Download the archive

USDA Food Desert data with Census tracts

USDA provides data on food deserts in the US. The data is provided as an Excel spreadsheet and can be joined to Census  tract Cartographic Boundary Files. A PostgresSQL dump of the table containing the food desert data joined to the Census tract geography is available for download.

Processing steps are document below.

#
# Food access data from USDA: http://www.ers.usda.gov/datafiles/Food_Access_Research_Atlas/Download_the_Data/Current_Version/DataDownload.xlsx
# data is in Microsoft Excel format, convert to CSV in your favorite spreadsheet software (note: too large for Google Sheets)
#

#
# create database in postgres
#

createdb -h localhost -p 5432 -U postgres food_access
password ******

#
# use your favorite CLI to postgress to create the table
#

CREATE TABLE food_access (
 censustract varchar(50),
 state varchar(50),
 county varchar(50),
 lilatracts_1and10 integer,
 lilatracts_halfand10 integer,
 lilatracts_1and20 integer,
 lilatracts_Vehicle integer,
 Urban integer,
 Rural integer,
 LA1and10 integer,
 LAhalfand10 integer,
 LA1and20 integer,
 LATracts_half integer,
 LATracts1 integer,
 LATracts10 integer,
 LATracts20 integer,
 HUNVFlag integer,
 GroupQuartersFlag integer,
 OHU2010 integer,
 NUMGQTRS integer,
 PCTGQTRS numeric,
 LowIncomeTracts integer,
 POP2010 integer,
 UATYP10 varchar(10),
 lapophalf numeric,
 lapophalfshare numeric,
 lalowihalf numeric,
 lalowihalfshare numeric,
 lakidshalf numeric,
 lakidshalfshare numeric,
 laseniorshalf numeric,
 laseniorshalfshare numeric,
 lahunvhalf numeric,
 lahunvhalfshare numeric,
 lapop1 numeric,
 lapop1share numeric,
 lalowi1 numeric,
 lalowi1share numeric,
 lakids1 numeric,
 lakids1share numeric,
 laseniors1 numeric,
 laseniors1share numeric,
 lahunv1 numeric,
 lahunv1share numeric,
 lapop10 numeric,
 lapop10share numeric,
 lalowi10 numeric,
 lalowi10share numeric,
 lakids10 numeric,
 lakids10share numeric,
 laseniors10 numeric,
 laseniors10share numeric,
 lahunv10 numeric,
 lahunv10share numeric,
 lapop20 numeric,
 lapop20share numeric,
 lalowi20 numeric,
 lalowi20share numeric,
 lakids20 numeric,
 lakids20share numeric,
 laseniors20 numeric,
 laseniors20share numeric,
 lahunv20 numeric,
 lahunv20share numeric
);

#
# import the food_desert.csv file
#

COPY food_access FROM '/path/to/food_desert.csv' DELIMITER ',' CSV HEADER;

#
# prepare database for census tract spatial data
#

CREATE EXTENSION postgis

#
# script to download, extract, and import Census Boundary Files of tracts into postgres.
# note 1: if you are using postgres.app, you might have to provide the full path to executables
# note 2: I use 7zip for zip files. If you use a different program, change accordingly
#

importtracts.sh
# begin script

# create table structure then delete data to prevent duplicates
shp2pgsql -s 4269 '/Users/sparafina/Downloads/cb_2014_01_tract_500k.shp' tracts2010 | psql -U username -d food_access
psql -U username -c 'delete from tracts2010' -d food_access

# download, unzip and import
for s in {'01','02','04','05','06','08','09','10','11','12','13','15','16','17','18','19','20','21','22','23','24','25','26','27','28','29','30','31','32','33','34','35','36','37','38','39','40','41','42','44','45','46','47','48','49','50','51','53','54','55','56'}
 do
 wget 'http://www2.census.gov/geo/tiger/GENZ2014/shp/cb_2014_'$s'_tract_500k.zip'
 7za e 'cb_2014_'$s'_tract_500k.zip'
 shp2pgsql -a -s 4269 '/Users/sparafina/Downloads/cb_2014_'$s'_tract_500k.shp' tracts2010 | psql -U username -d food_access
done

# create index
psql -U username -c 'create index tractis2010_gist on tract2010 using gist (geom)' -d food_access

# end script

# 
# switch back to postgres CLI
#

# add column to join tables 
# note 1: added this step to clarify but not necessary with a bit more sql
ALTER TABLE tracts2010 ADD COLUMN foodaccess_id varchar(50);

# populate join key in tracts2010
UPDATE tracts2010
 SET foodaccess_id = statefp || countyfp || tractce;
 
# join food_access to tracts2010 to create a new table
CREATE TABLE food_access_tracts AS
 SELECT *
 FROM tracts2010 INNER JOIN food_access 
 ON tracts2010.foodaccess_id = food_access.censustract;

# export the table, if desired
pg_dump -t food_access_tracts food_access > '/path/to/food_access_tracts.sql';

Online desktop applications

In a fit of Saturday morning creativity inspired by several cups of coffee, I wanted to make a weak troll of the Hillary campaign logo. However, I didn’t have Gimp installed on my computer because who wants Gimp installed on their computer?

The logo reminded me of Rimmer the hologram from Red Dwarf.

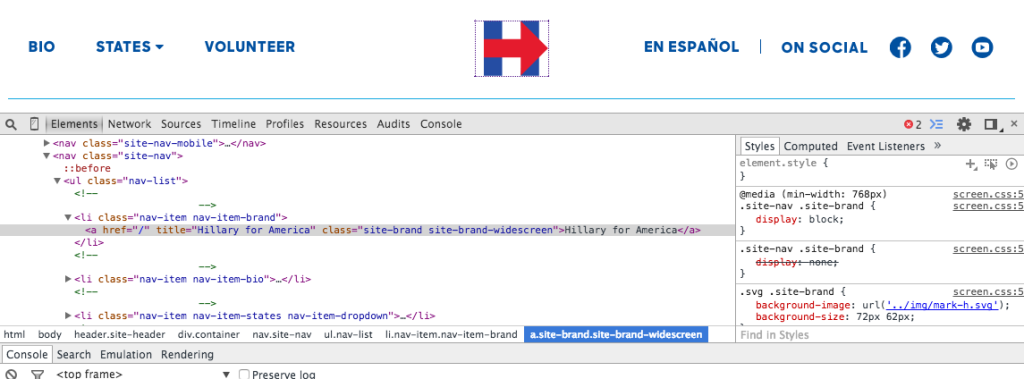
The Hillary Clinton campaign site generously provided the logo as an SVG. Which I converted on line to a PNG with a background transparency.

Screen Shot 2015-04-20 at 10.03.14 AM

Again, the internet provides.

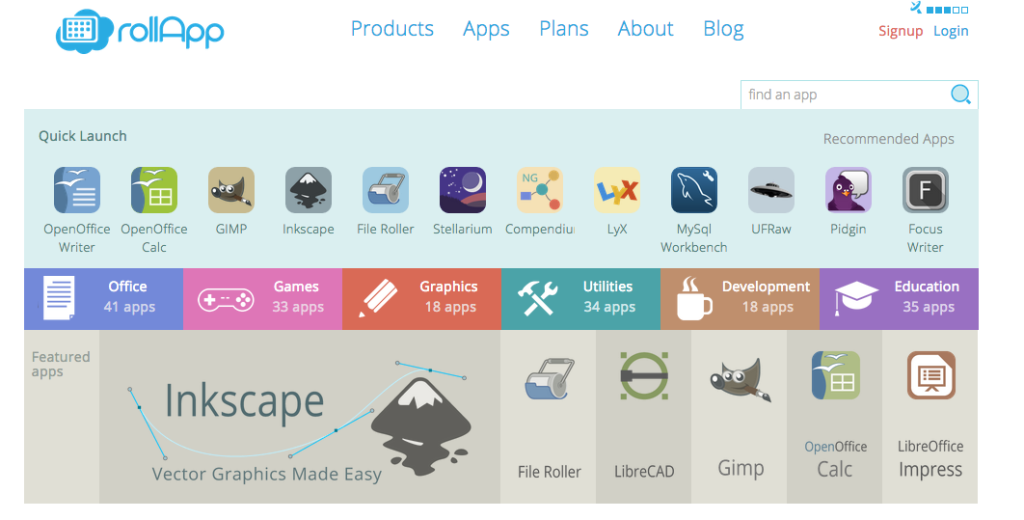
But what about Gimp, the dilettante’s answer to Photoshop? Fortunately there’s rollapp.com, that provides quite a number applications through the browser, including Gimp.

Screen Shot 2015-04-20 at 10.32.34 AM

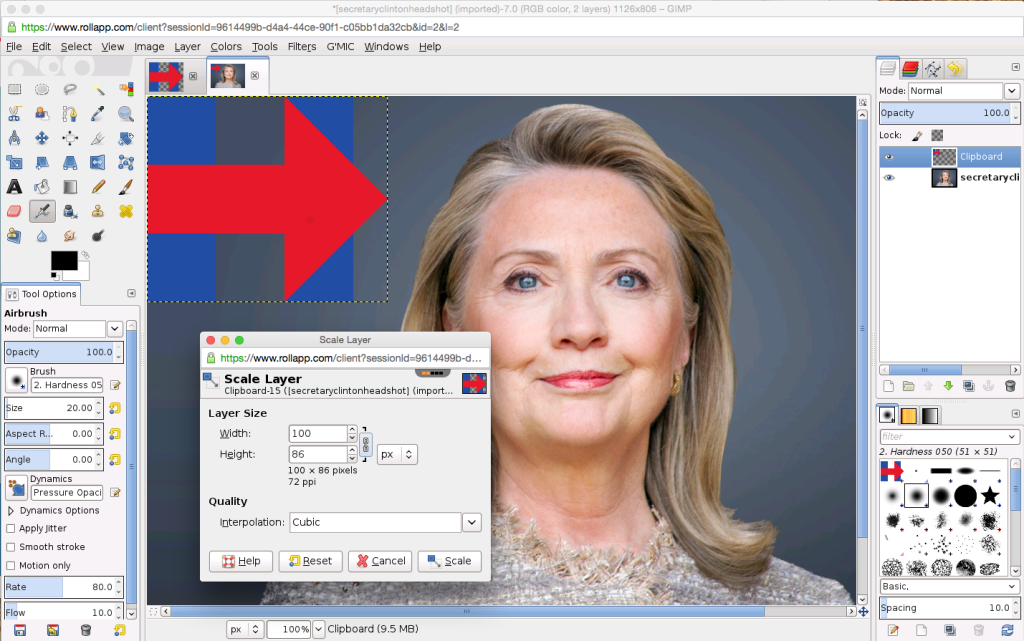
There are several options for online storage, i.e. a place for reading and writing files, including Google Drive  and DropBox. I uploaded my files to DropBox, opened them in Gimp, and scaled the logo.

Screen Shot 2015-04-20 at 10.39.20 AM

I placed the logo in the appropriate place, saved the file and tweeted away.

Screen Shot 2015-04-20 at 10.42.49 AM

It’s amazing that I can run the full version of desktop software in browser and it’s not all running within the ecosystem of a single company <cough> oogle</cough>. Thanks @rollapp!